

Investment Insights
Key Takeaways
- Economy is undergoing a mild recovery. Consumption is the key determinant to the extent of the recovery
- Liquidity remains high, and fiscal policy will become the main driving force
- The stock market will undergo fluctuation and adjustment, and portfolio construction will be more balanced
- More opportunities in corporate bonds than government or quasi-government bonds
I. Current Economic Situation and Monthly Macroeconomic Outlook
According to Zofund’s internal economic cycle model, the economy continues to be in “recovery”, meaning that current economic data has already started to show mild improvement. “Recovery” means the economy is still trending downwards; however overall liquidity has become high. From the diagram, we can see that the economy was in the “recovery” quadrant in 2019, and should have stabilized in 2020. However, the unexpected Coronavirus pandemic caused the economy to fall into recession. With our effective containment of the virus and expansionary fiscal and monetary policy, the economy has transitioned from “recession” to “recovery”. The resumption of work and production has led to improvement in economic data over time.
Looking ahead to the second half of the year, we expect the economy to continue its mild recovery, with industrials and infrastructure investment undergoing a faster recovery. The high liquidity environment will speed up real estate investment, with faster land acquisitions and development. The biggest variable will be how to stimulate consumption after the reduction in personal income. This will determine the extent of economic growth.
Regarding policy measures, liquidity remains high, and the focus is shifting from monetary to fiscal policy. Overall objectives of the policy are maintaining employment levels, ensuring people’s livelihood, and helping small and micro enterprises. These policy objectives all translate into promoting consumption.
With regards to asset allocation, the stock market has undergone recovery and is entering a period of fluctuation and adjustment. While market movements vary by sectors, a balanced allocation on consumer staple and cyclical sectors would stabilize overall performance. In fixed income investments, corporate bonds are more preferable over government or quasi-government bonds. There are opportunities in value investing in municipal investments, real estate, and industrial bonds. Key risks come from a second wave of the virus outside of China and the US-China relationship, which will affect the risk appetite of investors.
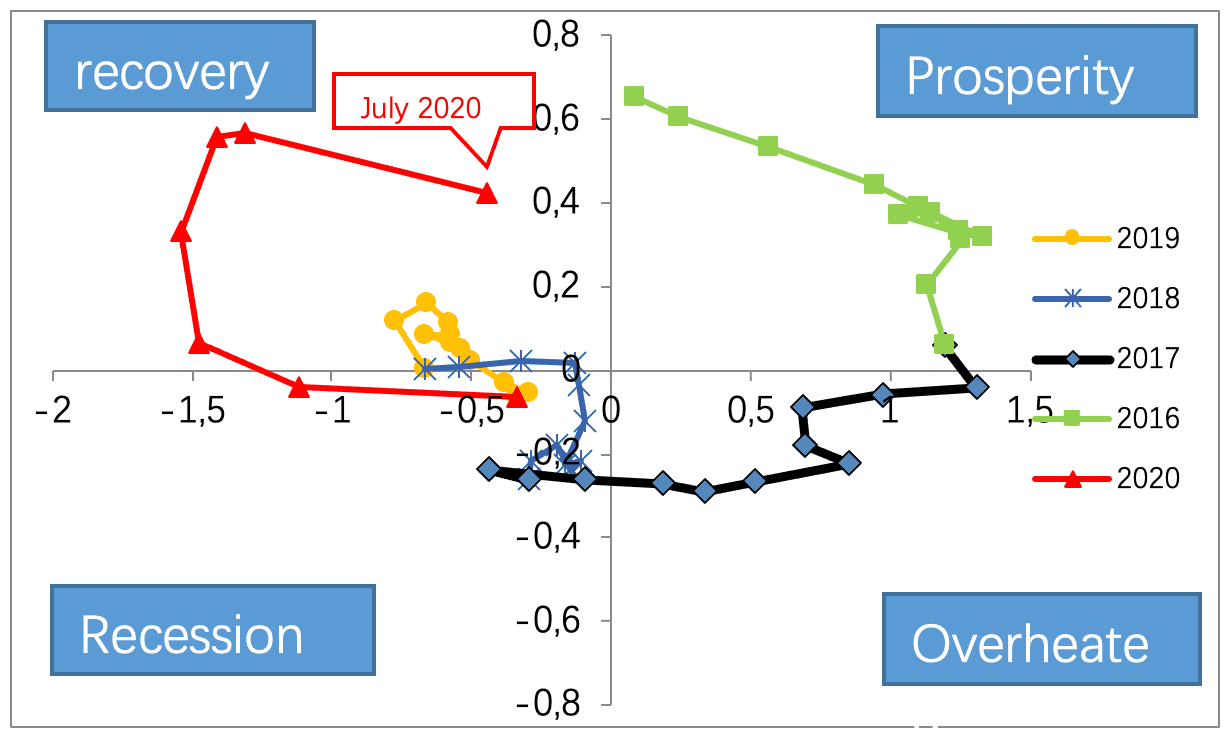
Data Source: Wind, Zofund
II. Domestic Economy: Mild Recovery During the Final Stage of Coronavirus Pandemic
1. Manufacturing: Continuous Recovery
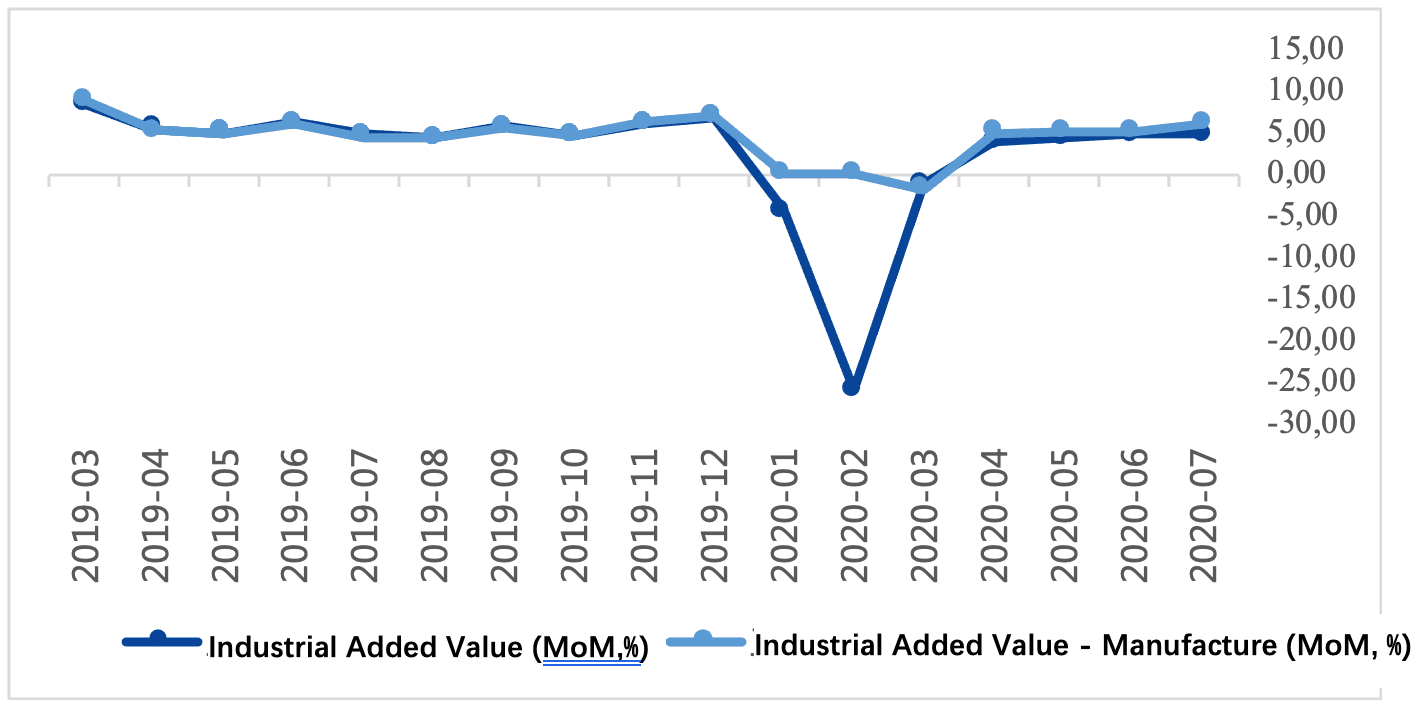
Industrial Sector’s growth rate turnaround. Looking at production, the industrial sector’s growth from January to July was -0.4%. However, in the month of July, the growth rate continued to grow, and reached normal levels of 4.8%. Manufacturing managed to recover faster, while the growth rate for large-scale construction and investment projects like mining for July slowed down due to heavy rain and floods. In July, the YoY growth rate of the manufacturing sector reached 6%, proving the recovery in the manufacturing PMI.
Comparison between Industrial Added Value and Manufactural Added Value
Data Source: Wind, Zofund
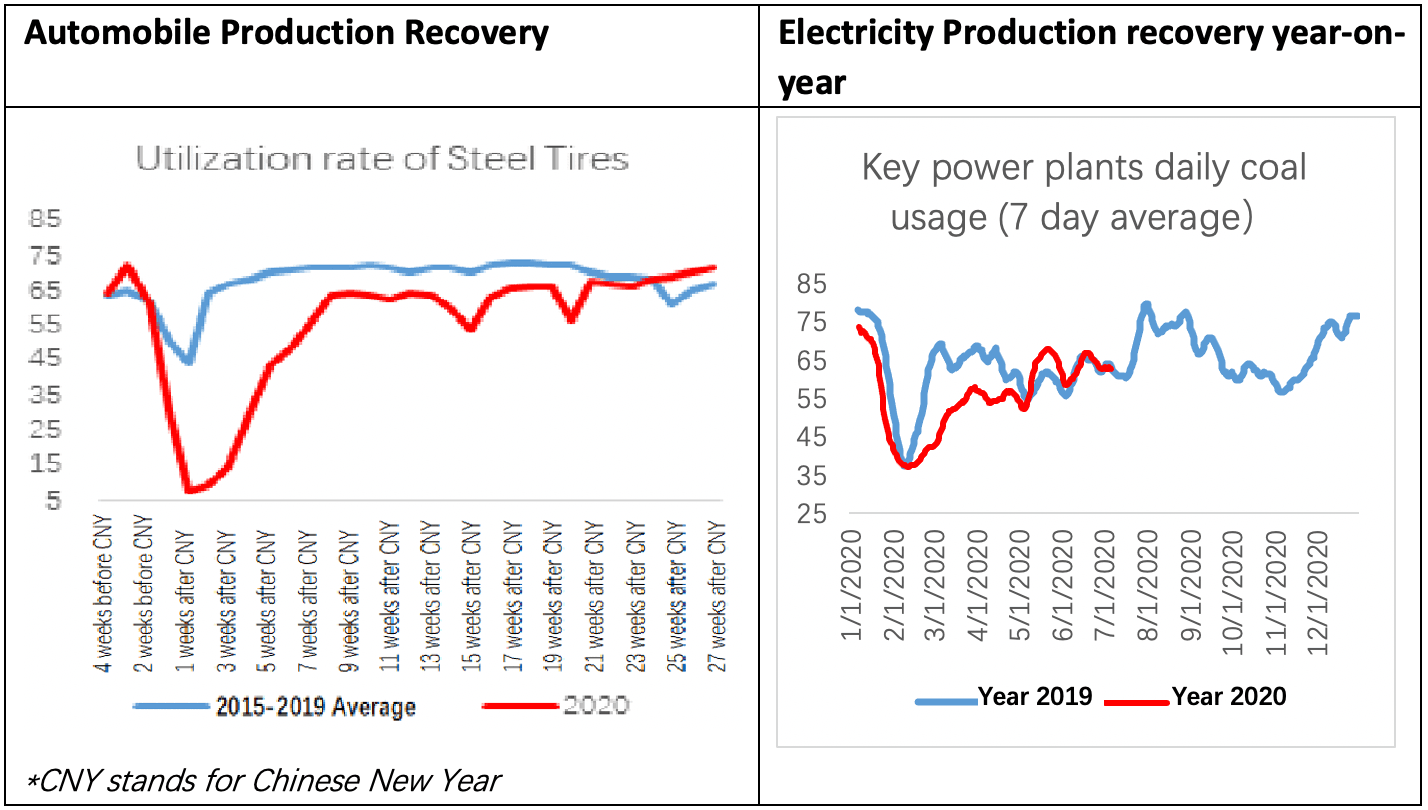
Electricity generation recorded positive monthly increase. Production also rebounded. From a microeconomic perspective, the increase on electricity generation further proved the increase in production of the industrial sectors, along with increasing productions on key Industrial products. Upstream coal production dropped slightly and growth in crude oil processing turned positive. Production growth in midstream industries such as aluminum, cement, ethylene, and chemical fiber all shifted from negative to positive. Non-ferrous metals experienced a slight increase, while the growth rate of automobile production improved significantly and turned positive. As a whole, the largest contributions to output in July came from electricity production and automobiles.
Data Source: Wind, Zofund
2. Investment: Positive Outlook on Real Estate and Infrastructure
Monthly growth rate is positive: From January to July this year, growth rate in fixed assets investments was -1.6% YoY, reaching close to pre- pandemic levels.
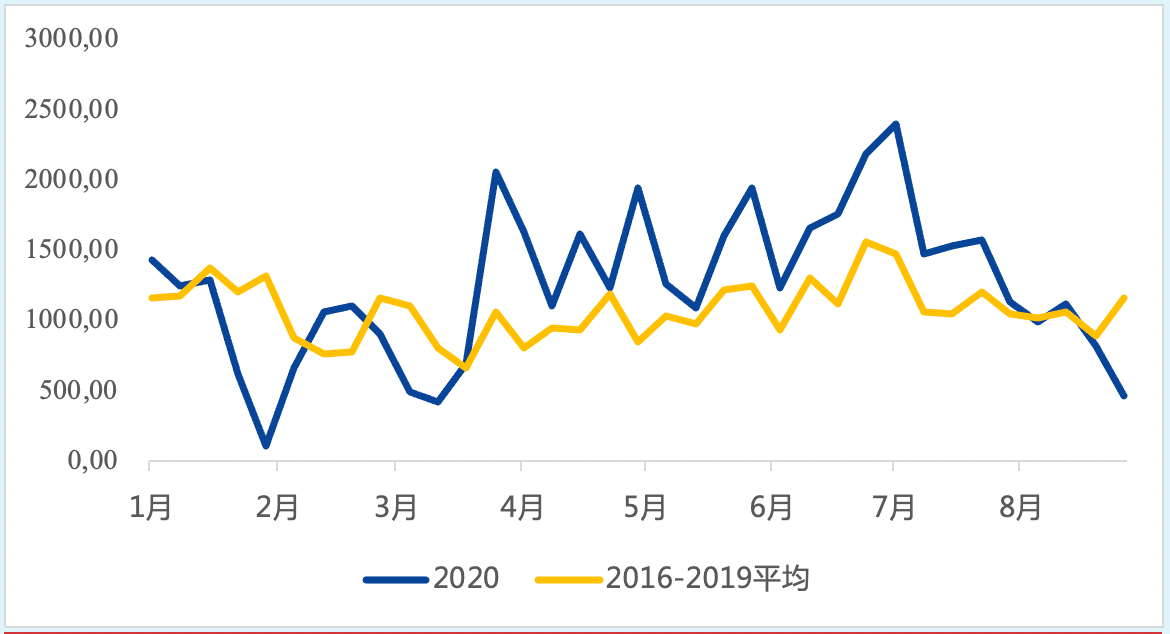
Land acquisition driving development and investment. Real estate sales returned to normal levels. While real estate transactions fell by 5.8% yoy, monthly growth in July was high at 9.5%. At the same time, residential land transactions increased significantly. The increase in land transactions implies an increase in development and investment. In July, new projects commencement increased by 11.3%, and investment also increased significantly by 11.7%.
Land Space Sold in Top 100 Cities(Units: million square meter)
Data Source: Wind, Zofund
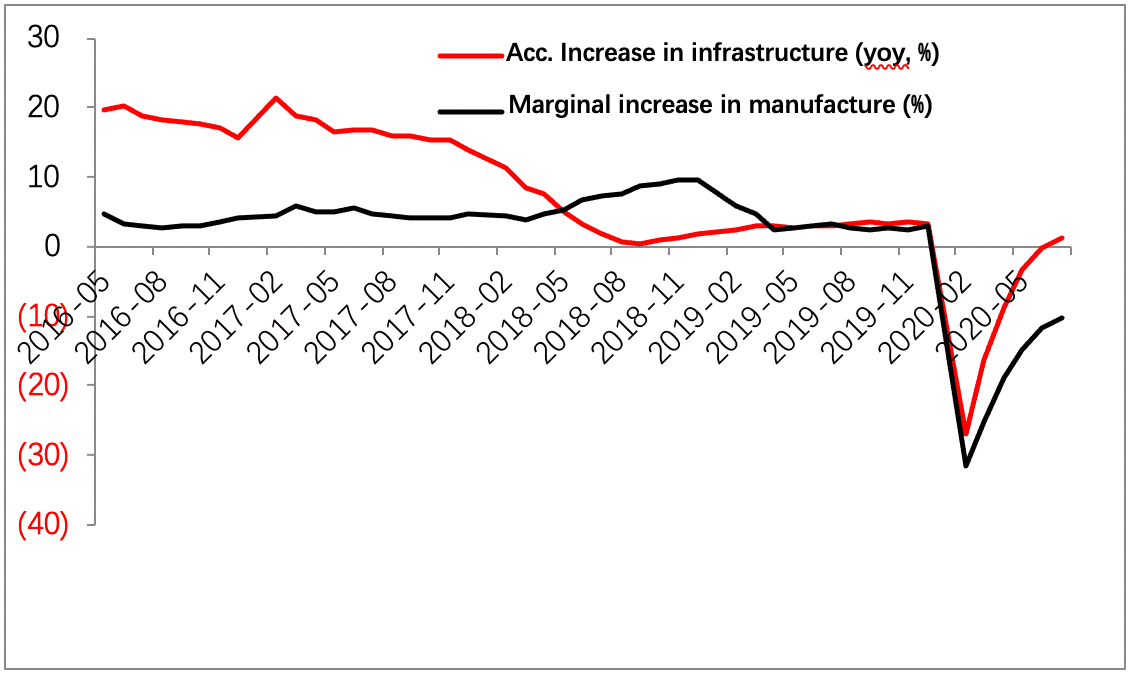
Infrastructure investment recovers and returns to positive growth. Under the issuance of project-specific bonds, infrastructure investment continued to recover. From January to July, infrastructure investment returned to positive growth to 1.2%. In July, the monthly growth rate reached 8%. Investment in electric plants also continued to grow steadily.
Data Source: Wind, Zofund
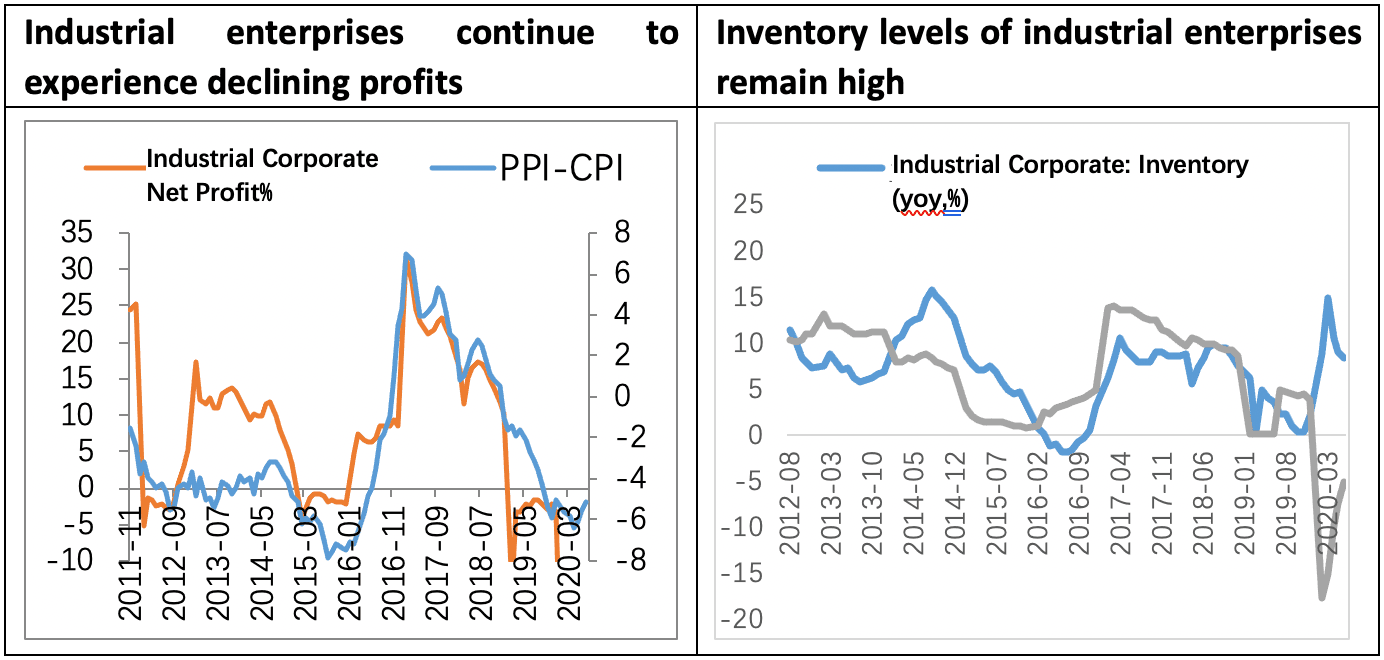
Rate of decline of investments in manufacturing narrowed. From January to July, investments in manufacturing continued to shrink, but by a smaller rate of -10.2% YoY. Monthly growth improved, even though it was still negative. Due to the major decline in manufacturing profits experienced previously, the recovery of manufacturing investment was still quite slow.
Data Source: Wind, Zofund
3. Consumption: residential consumption potential needs to be motivated.
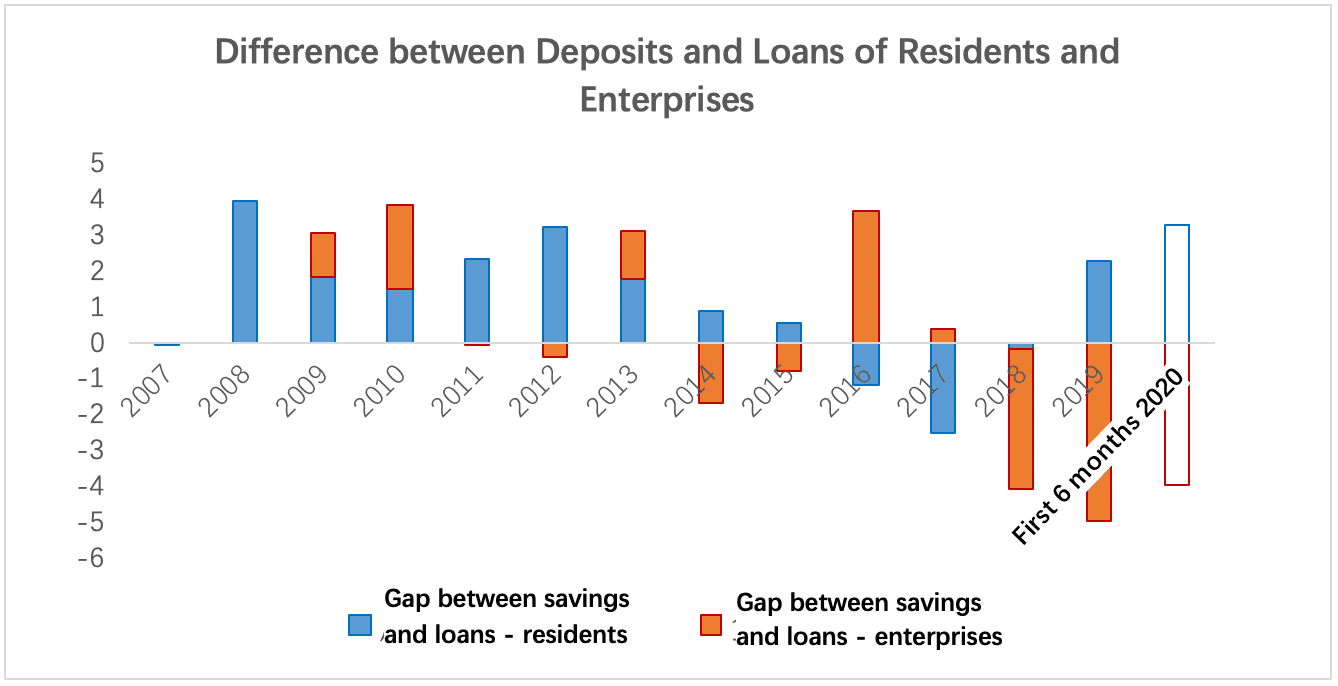
To motivate the consumption is essential. China's current account surplus was decreasing, implying that the idea of “surplus savings”, which China has traditionally relied on for development started to disappear. Such phenomenon has led to a question that whether the country shall continuously rely on absorbing global savings or creating its own savings internally?
To absorb global savings: along with the financial openness and internationalization of Chinese yuan versus U.S.-dominant financial market, China is likely to encounter ongoing challenges from the United States and external conflicts will become the norm.
To create domestic savings: The personal net worth of Chinese residents may be the highest it has been over the last 5 years., despite the impact of the epidemic. To keep it well maintained there must be a determined effort to maintain employment, resident’s livelihood, and confidence, which will promote consumption by the Chinese people. On the other hand, the balance sheets of government and corporate might be worst over the last 5 years, and it requested additional special debts and special government bonds to make up the loss. However, it was only short-term solution. For corporate to be able to generate stable “surplus savings”, real transformation and upgrade of the manufacturing industry need to be in place to enhance efficiency.
Data Source: Wind, Zofund
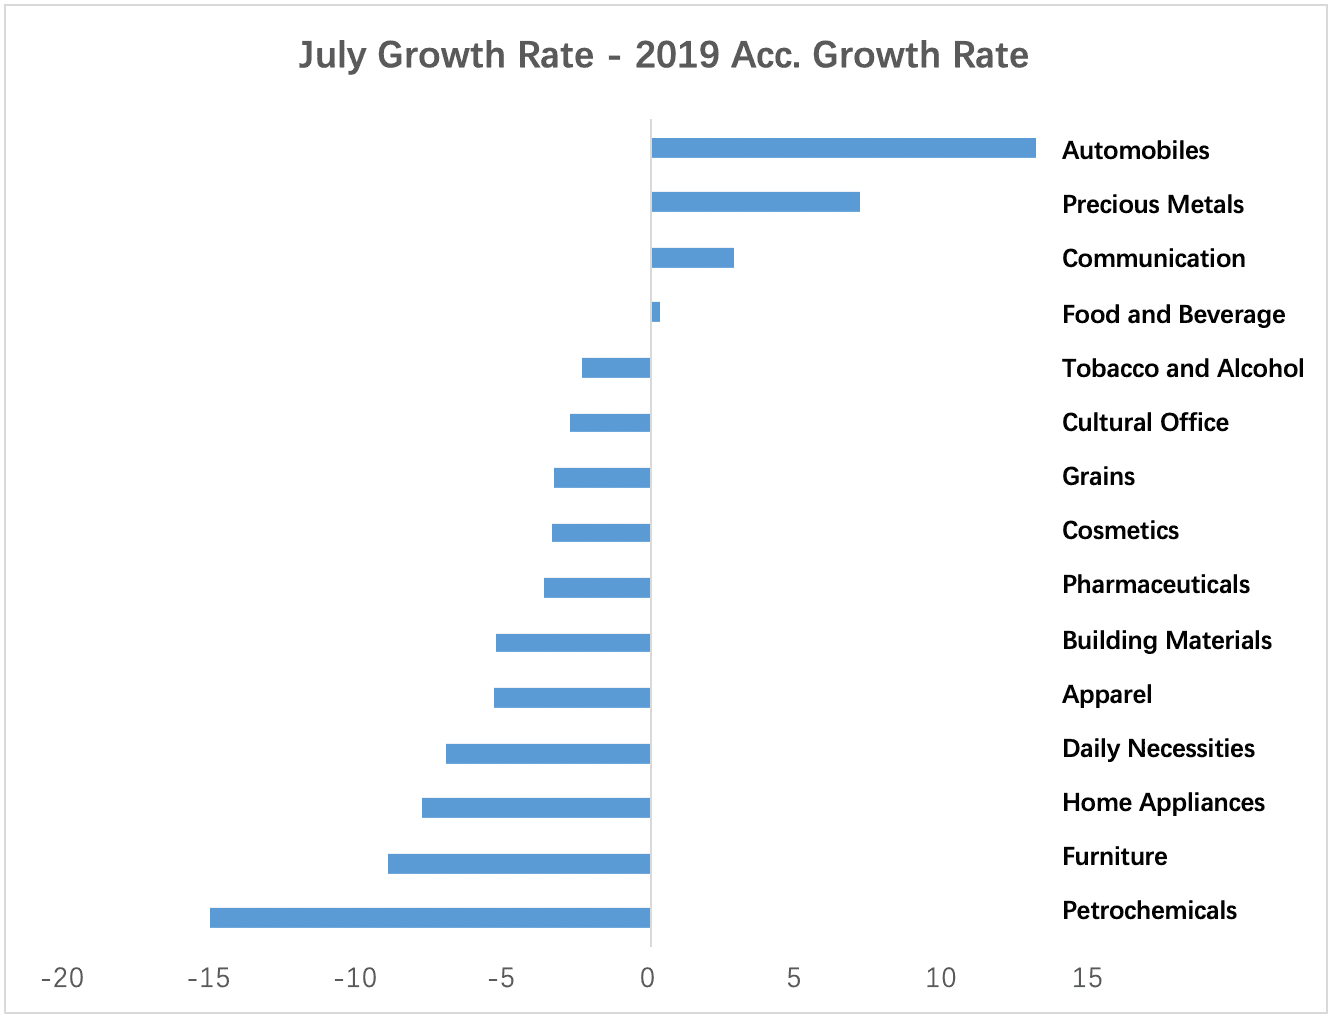
Strong Consumer Staple and diverged consumer discretionary. Total retail sales from January to July fell by 9.9% YoY, and recovery was slow given retail sales in July still fell by 1.1%. Online sales recovered relatively quicker, with the growth rate for the month reaching 15.7%. Food and beverage and pharmaceutical spending were the key driver, whereas apparel, restaurants and dining, and transportation were laggers. Among consumer discretionary items, automobiles and mobile phones have been on the rise.
Data Source: Wind, Zofund
4. Imports and Exports: remain weak
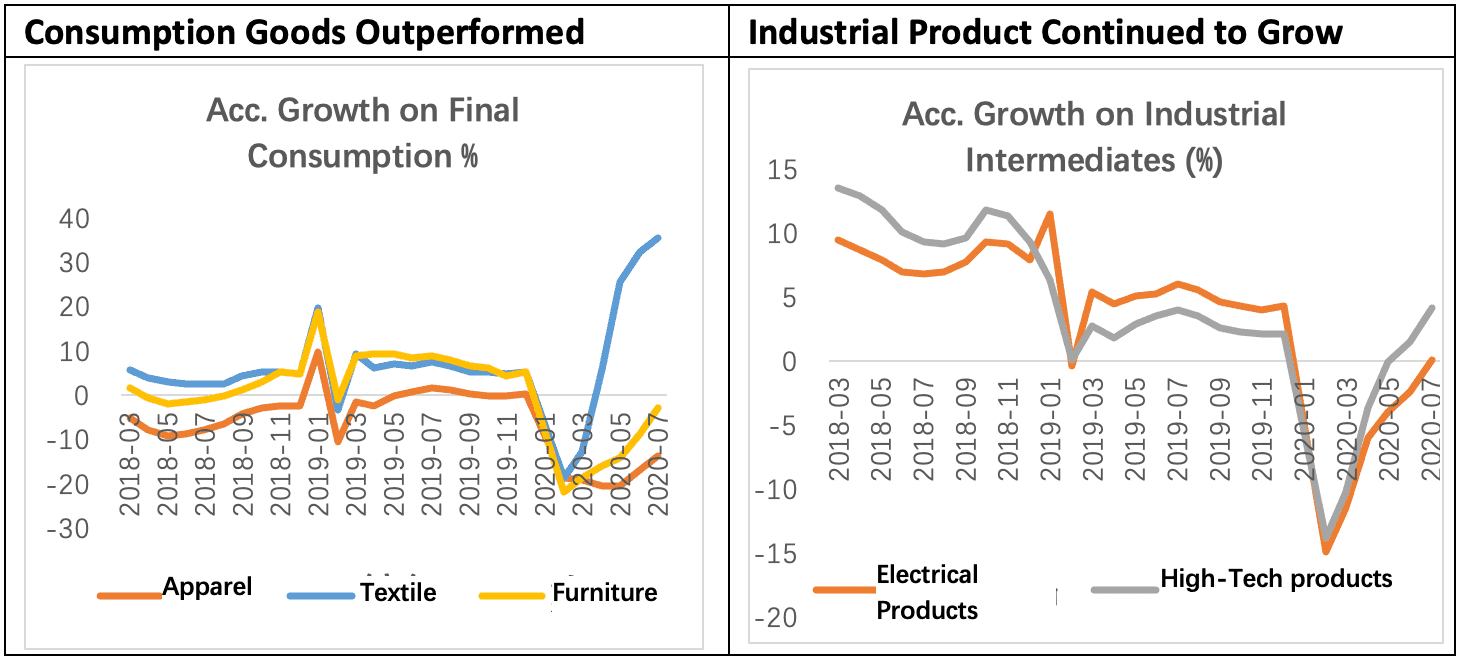
Final consumption fell and industrial intermediates continued to grow. Exports growth in July were 7.2%, up from 0.5% in June, while imports growth were -1.4%, down from 2.7% in June. Manufacturing activities in Europe and the United States were suspended in March and April and was later resumed in May. Overseas demands gradually recovered since June. At mean time, external demands on medical supplies was huge due to the pandemic, with growth rate of 5% to 7%. Consumer goods, on the other hand, still recorded negative growth while industrial intermediates regained positive momentum.
Data Source: Wind, Zofund
Prices level:
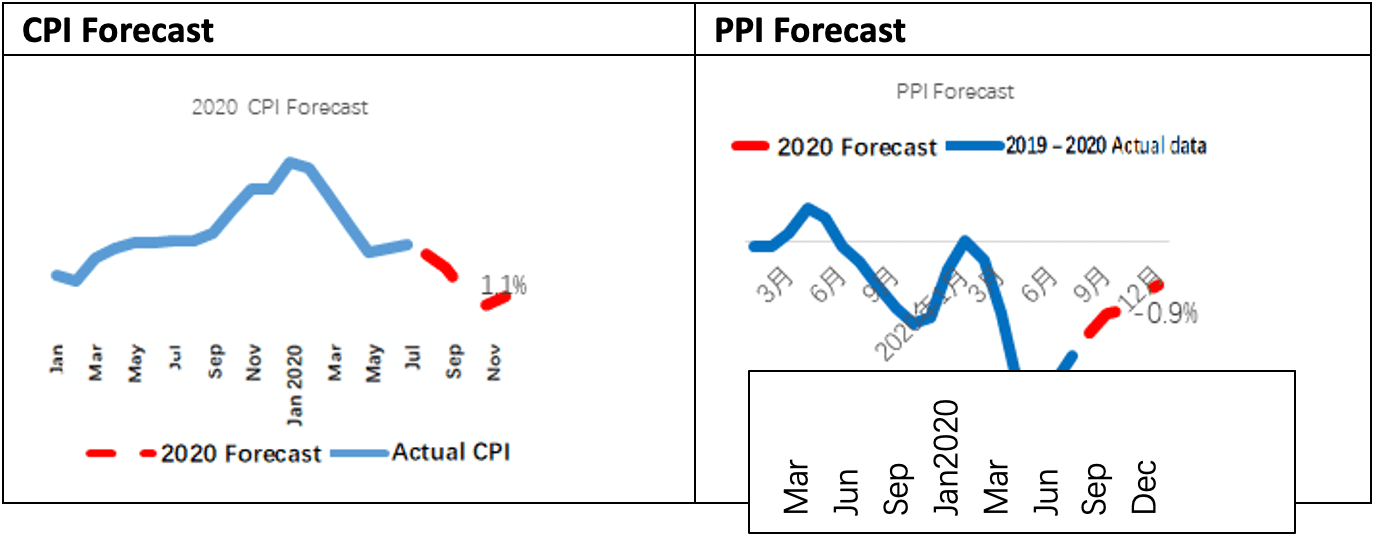
CPI is expected to decrease each quarter. CPI in July was 2.7%, up by 0.2% from June level. It was driven by increasing hog price. In the short run, the volatility on hog price is likely to moderate but it won’t change the downward forecast on CPI.
PPI remained deflated. PPI was -2.4% in July, positive month-on-month. Oil prices rebounded in the second half of the year, flattening the downward trend of PPI, and the overall PPI remained in the deflationary range. It is expected to turn positive in 2021Q1 or 2021Q2 (assuming oil prices remain mildly recovered to $45-55 per barrel).
Data Source: Wind, Zofund
III. Internal Policies: Monetary Policies remain moderated while fiscal policies stay hawkish
1. Monetary Policies: moving from monetary easing to credit easing
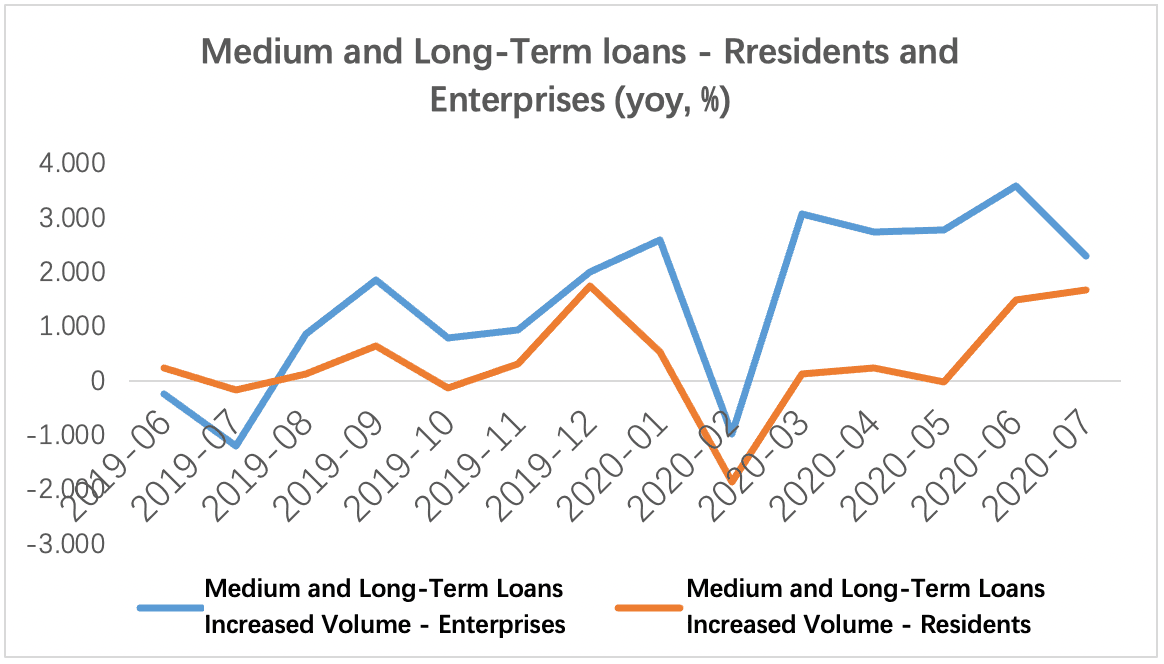
In July, the new social financing amount reached 1.69 trillion yuan, rising by 0.4 trillion yuan yoy. The reserved total social financing amount rose 12.9%, up 0.2 percentage points from June, a new high in recent years. Compared to the same time last year, the reserved amount increased more than 34 trillion yuan, including 20 trillion yuan in loans, 8 trillion in government bonds, 4 trillion in corporate bonds, 1.2 trillion write-off, 1 trillion in equity and others. Due to lower base last year, this year the full-year growth rate is possible to reach 13.7% (current level was 12.9%), carrying on with the strong upward trend in the rest of the year.
The credit structure was good in July. The growth rate of both long-term and short-term loans was higher this month, indicating residents are taking more leverage. Under current looser credit conditions, outlooks on real estate sales in near future are positive. The medium and long-term loans continued to increase at a high rate as 13.72%, showing strong demands on loans used for infrastructure and real estate. On the other hand, a trend of contracted supplies on short-term loans and notes has shown the central bank’s intention to gradually control credit expansion.
Data Source: Wind, Zofund
2. Fiscal Policy: accelerating spending
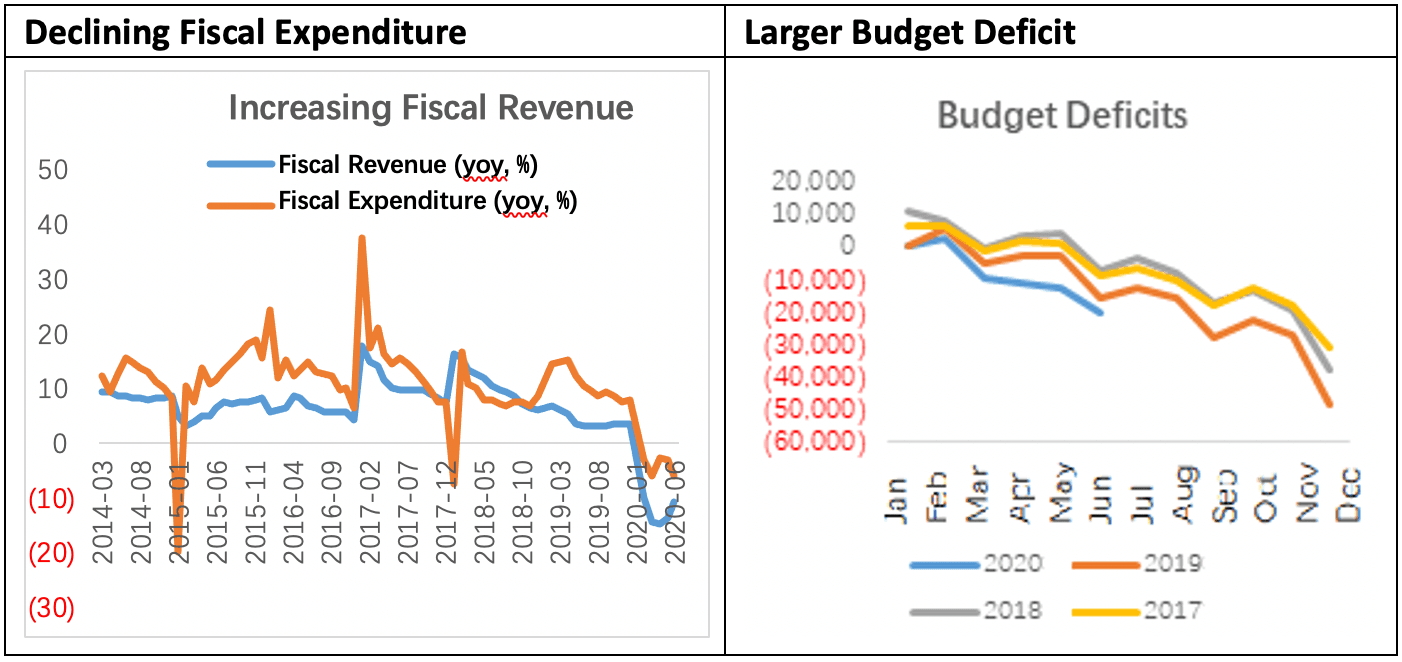
Fiscal revenue growth has turned positive. Even though the base of the same period last year has been raised, the year-on-year growth rate of fiscal revenue in June was still positive to 3.2%, the highest this year. It was supported by the picking-up central revenue (1.9%) along with the increase on local revenue (4.3%). Tax revenue also regained positive growth to 9%, while non-tax revenue growth narrowed to -17%. The effects of promoting the resumption of work and bail-out of enterprises were evident, resulting in the first positive fiscal revenue growth this year.
The decline in spending has widened. The year-on-year decline in fiscal spending in June widened to -14.4%, the lowest growth rate since 2005. The central spending narrowed slightly (-8%) while local spending continued to decline (-15%). A higher base over the same period last year and an overdraft in upfront spending have pushed fiscal spending growth to an all-time low.
Fund revenue continued to rise. In June, the cumulative yoy growth of government fund income was -1%, a better result compared to the first 5 months. The central growth rate narrowed to -20%, the local growth rate finally turned positive to 0.3%, and the growth rate of land transfer income rebounded significantly to 5.2%.
Data Source: Wind, Zofund
IV. Though remaining volatile in the short-term, government bonds still carry with long-term investment opportunities.
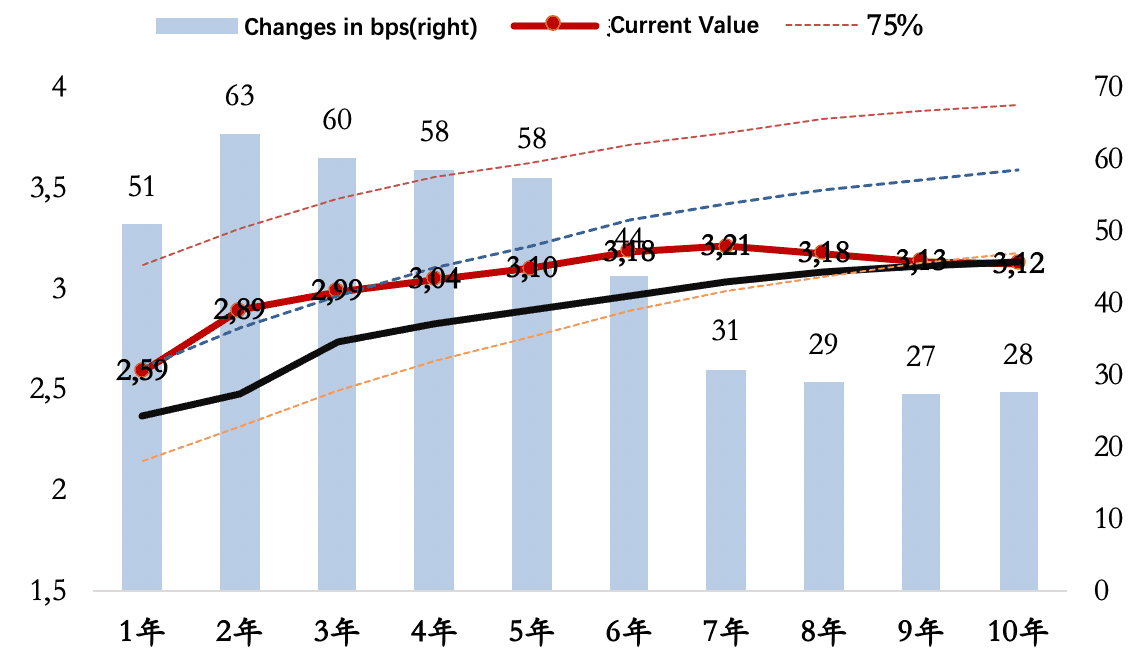
Looking back the third quarter of this year, market liquidity was in a tight balance due to low excess reserve rate in banks. Rising in short-term interest rate was manifested while the yield of one-year treasury bill rose by 51bps in the past three months. Yield of ten-year treasury bonds was over 3.1%, near the first quartile of historical average, surpassing the pre-epidemic level.
Yield Curve of Government bonds – Quarterly Changes
Data Source: Wind, Zofund
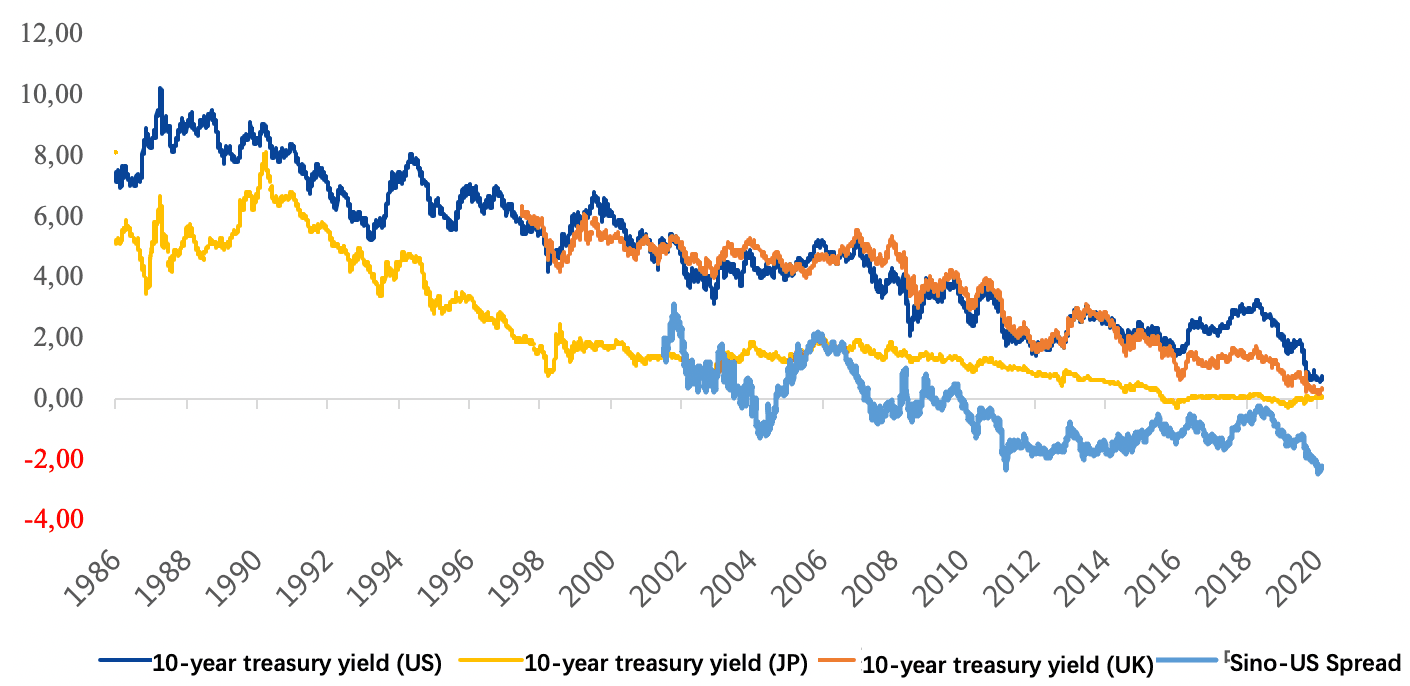
Ten-year treasury yield in UK, US and Japan, and Sino-US yield spread (%)
Data Source: Wind, Zofund, Sino-US=10-year treasury yield (US)- 10-year Treasury Yield (UK)
Look ahead to the fourth quarter this year, the market is still likely to be influenced by both positive and negative emotions, without clear sign of which to dominate. On the one hand, economy is recovering fundamentally, and according to CICC’s forecast, the testing on new Covid-19 vaccine is highly possible to be successful in the fourth quarter, with over 95% winning probability. On the other hand, we have observed that the speed of recovery momentum starts to slow down. The land trading volume might decline after tightening methods are in place. However, we believe the monetary tightening scope won’t reach beyond our expectation once the issue of currency idling is under control.
If looking at a longer time horizon, government bond yields are still in a downward trend. Ever since late 80’s, the interest rates in Europe, the United States and Japan have been decreasing and at present, both Europe and Japan are still struggled with negative interest rates. And in the United States, after implementing the new monetary policy to adopt average inflation target, the interest rate is also approaching to the negative zone. As the Sino-US yield spread continues to hit historical low, the increasing demands on Chinese bonds for asset allocation purposes will be the major supports to the Chinese fixed-income market.
Corporate bonds have better investment potentials over government bonds. Alpha-seeking remains the key.
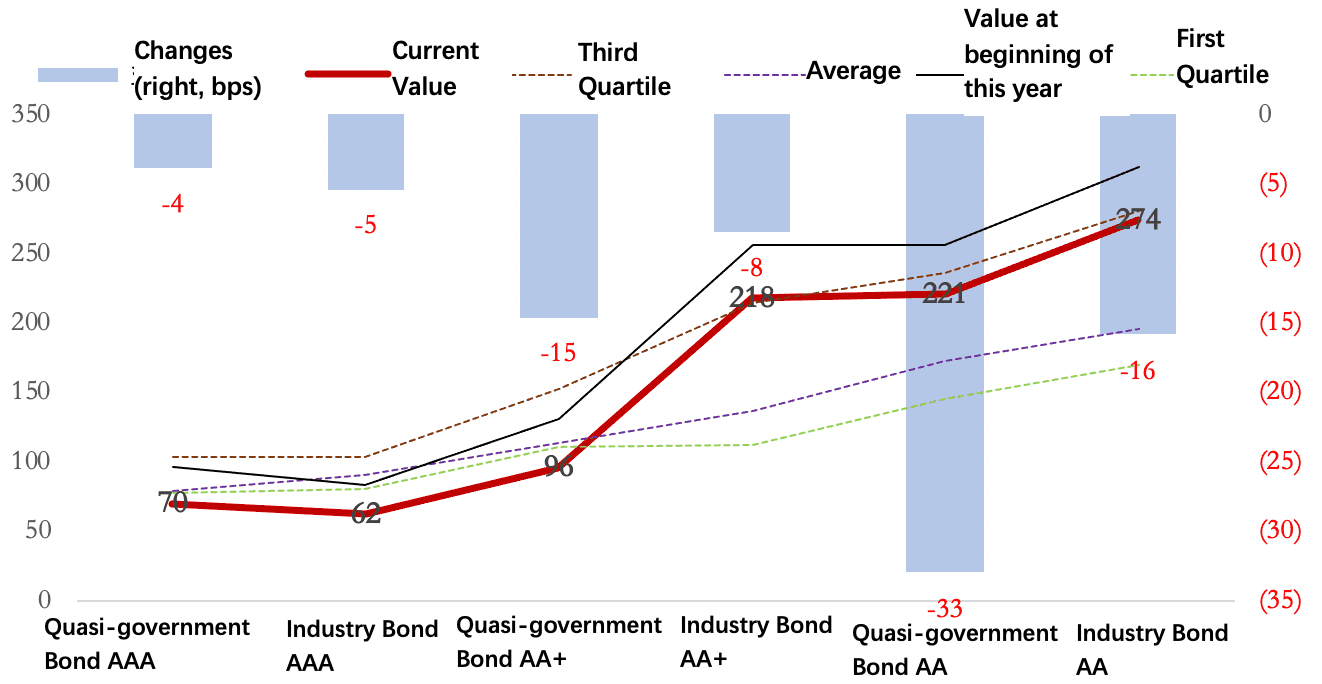
In terms of corporate bonds, the yield spread has reached historical low, regardless whether it’s high-rated quasi-government bonds or industrial bonds, but the room for further decreasing is limited. Even that, the market is still more inclined to favor lower-rated quasi-government bonds, especially AA-rated ones which the yield was down by 33 bps in past three months.
To break down by different categories, from the perspective of quasi-government bonds, a measurable investment in some lower-rated quasi-government bonds is considered reasonable to capture credit spread, such as those issued by well-developed districts or counties, or those issued by under-developed counties with lower debt ratio. At mean time, we will seek for special targets with liquidity premiums, like private debts and perpetual bonds.
From industrial bond perspective, if issued by more upstream entities, there are the more involvement from SOEs with more concentrated resources. If issued by downstream entities, there are higher participation of private enterprises and the more intense the market competition.
In recent years, the risks of corporate bonds are mainly revealed in the sectors with higher participation of private enterprises, such as pharmaceuticals, furniture, electrical appliances, and textiles. Even with loosen liquidity methods post pandemic, it is still hard to turn around the current financing shortage facing by those issuers. Therefore, regarding investments in industrial bonds, we tend to favor those with higher ratings and the chances of potential excess return might lie in a series of dynamic adjustments like SOE reforms, corporate consolidation, and other industrial adjustments.
From real estate perspective, the newly enforced regional regulations and financing rules have indicated that the tightening will last for a period of time but the demand side is still resilient according to results from high-frequent data. Short duration on regional leading names and SOEs is still worth investing and we will pay attention to long-term ones.
In terms of convertible bonds, due to the increasing volatilities in both equity and fixed-income markets, convertible bonds have also experienced huge turbulence this year, while performance in different sectors was diverged. Looking ahead to the fourth quarter, we consider the overall economy has shown clear direction on recovery pattern. The asset allocation appetite is likely to shifted from liquidity-driven to fundamental-driven, indicating a decreasing volatility on CB valuation. Sectors that fit into such recovery pattern will be benefited, such as cyclicals, financials, and mid-stream manufacturers. Overall investment style will tend to be more balanced.
We remain positive on the future performance of CBs. In the mid-term, investment themes will still focus on technology and consumption but in the short-term, cyclicals and financial also have allocation advantages. We will pay extra attention towards those with both low equity and CB price and better fundamental features.
Quarterly changes on spreads
Data Source: Wind, Zofund
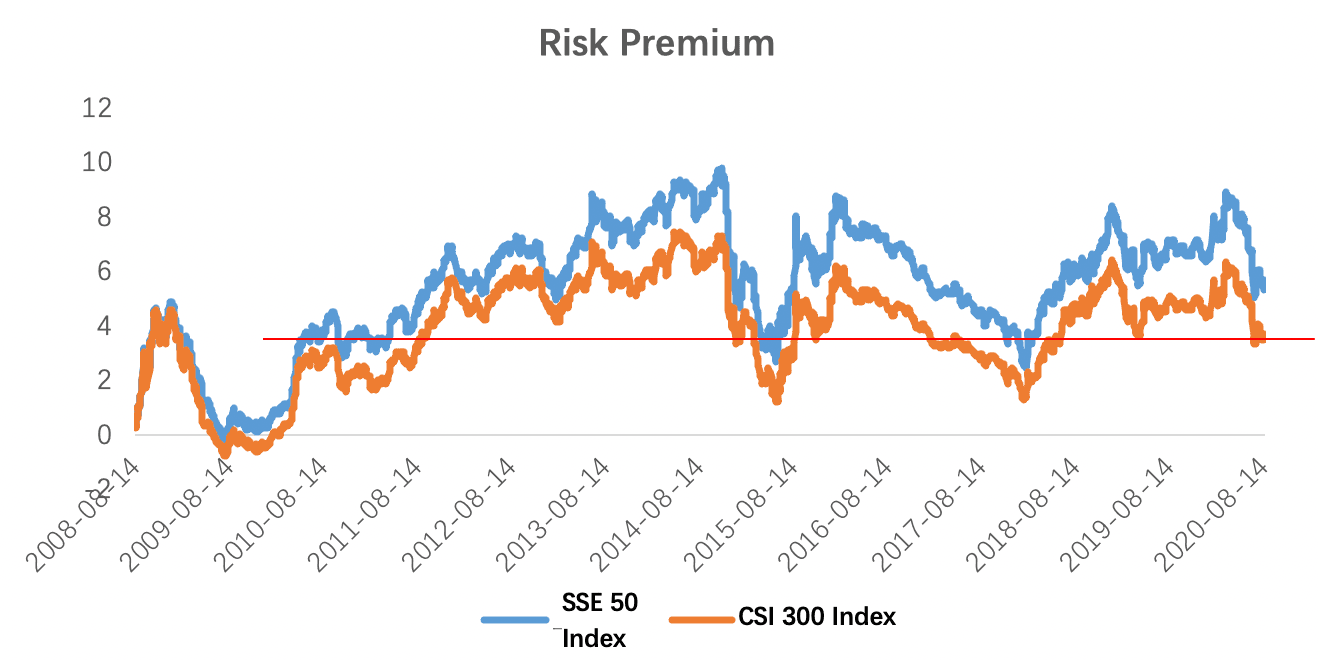
The stock market entered a period of structural volatility. We used earnings yield minus the yield of 10-year Treasury bonds to calculate the "risk premium" of the stock market. When the risk premium is high, the stock market is considered superior to the bond market, and vice versa. Currently, the risk premium is low, near the level in April 2019 and May 2018, meaning the stock market now enters a period of volatility adjustments.
Data Source: Wind, Zofund
Structural opportunities exist in the stock market. In the long run, consumption-oriented sectors are expected to have sustainable growth, including consumer staple (food, pharmaceutical, agriculture), consumer discretionary (housing, automobiles, mobile phones, apparel, retail), and consumer services (education, entertainment, finance, community). In 2020Q1, while economy was in a "recession" state, we tended to pay more attention on consumer staple. In 2020Q2 when economy begins to move towards a "recovery" state, we should focus more on consumer discretionary and consumer services. Besides consumer discretionary, we shall seek to a more balanced portfolio, with adequate allocation on lower-value cyclical sectors.
Disclaimer
This article is for reference only and does not constitute an offer, solicitation or invitation by Zhong Ou Asset Management International Limited(“ZOAM Intl.”) to deal in any fund, security or other investment product, nor does it constitute investment advice tailored to the circumstances of any particular person. The views and analysis contained herein reflect the independent personal judgment of the relevant analyst as of the date of publication, do not represent the position of ZOAM Intl., and may differ from the views of other departments, affiliates or personnel of ZOAM Intl.. Such views may be changed without notice. Investors should not rely solely on the content of this article to make any investment decision, and should, before making any investment decision, take into account their own financial situation, investment objectives and risk tolerance, and seek independent professional advice where necessary. Information referred to in this article is obtained from sources believed to be reliable, but ZOAM Intl. does not warrant its accuracy, completeness or timeliness.